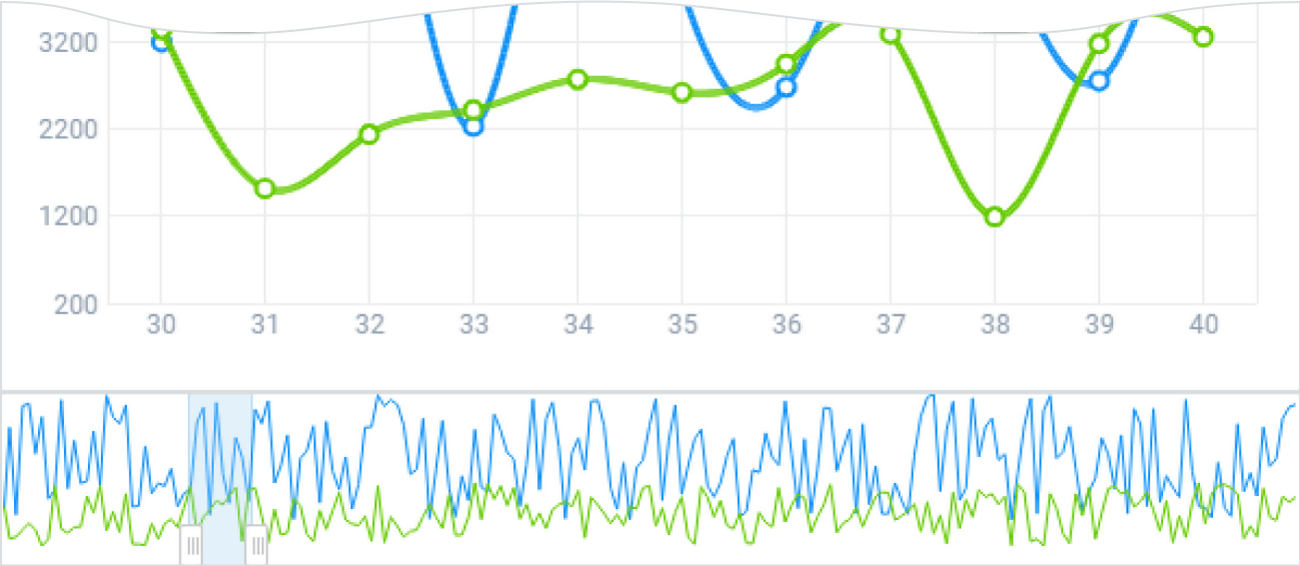
Highly customizable set of JS charts (line, spline, area, bar, pie, 3D-pie, donut, scatter, and radar). Nice and Interactive UI controls includes 14 types of charts and data tools like sorting, filtering and grouping.
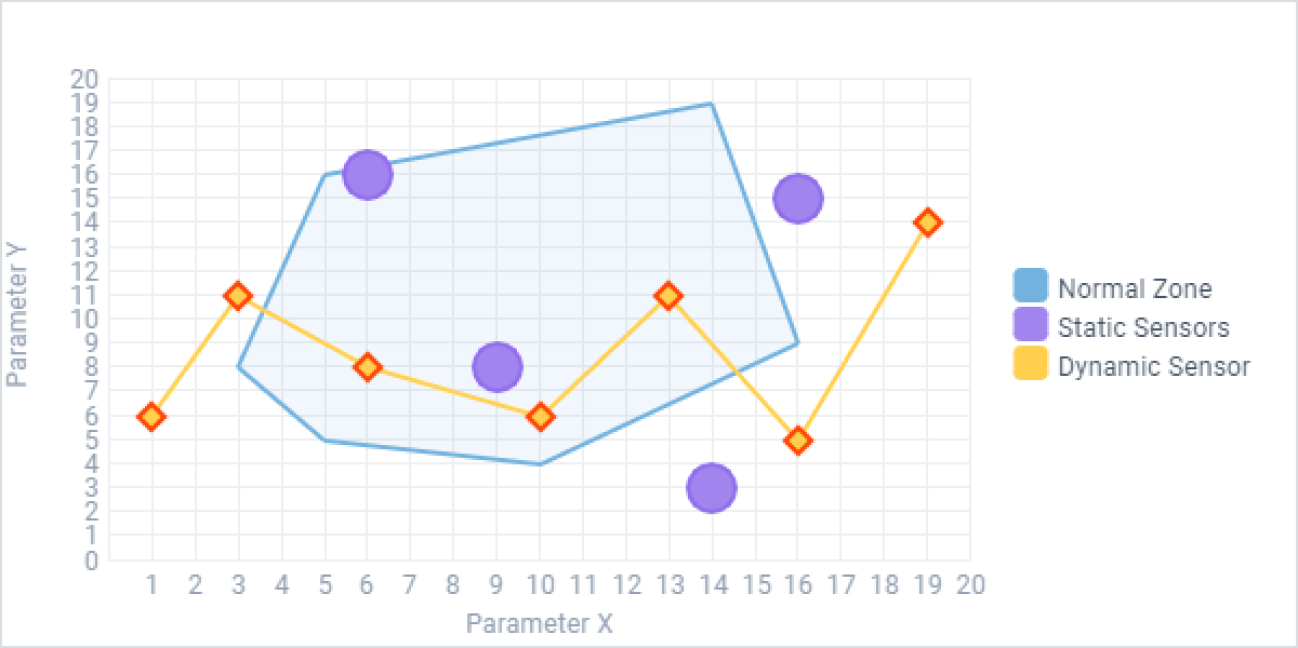
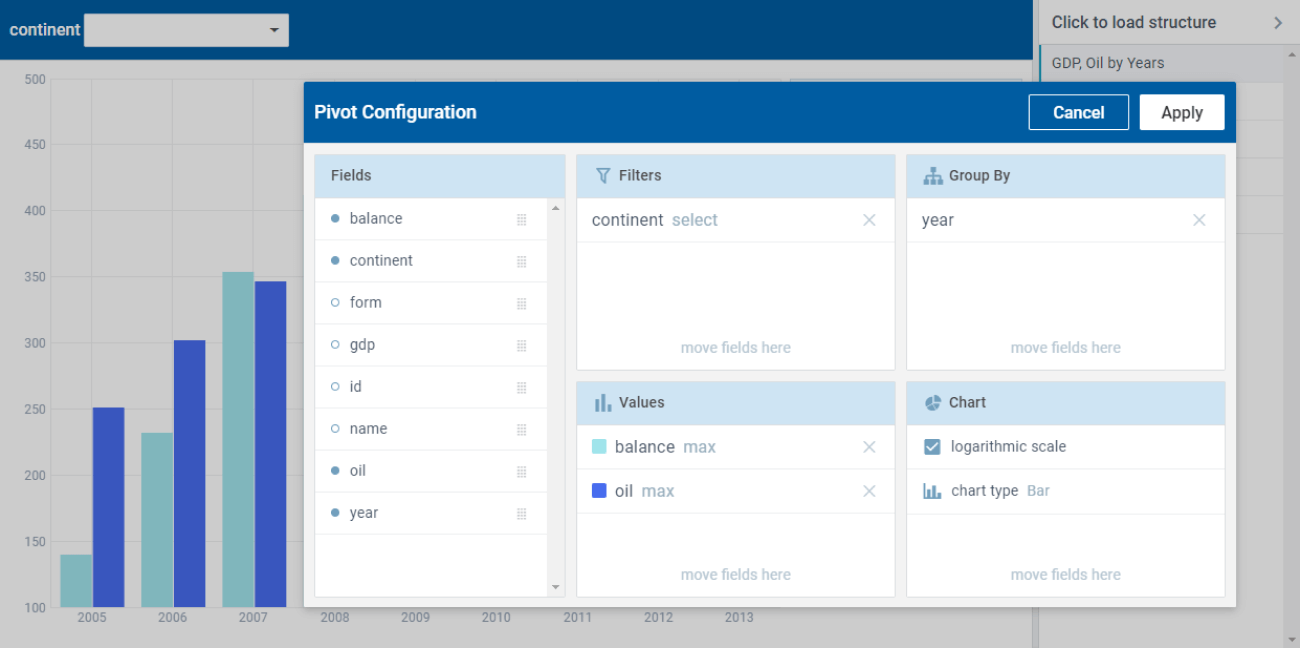
Nice and smooth data aggregation and visualization in form of different chart types and data-structure sets. Data export features to PDF, PNG, Excel and CVS formats. Easy back-end integration. Clear and transparent front-end integration and customization
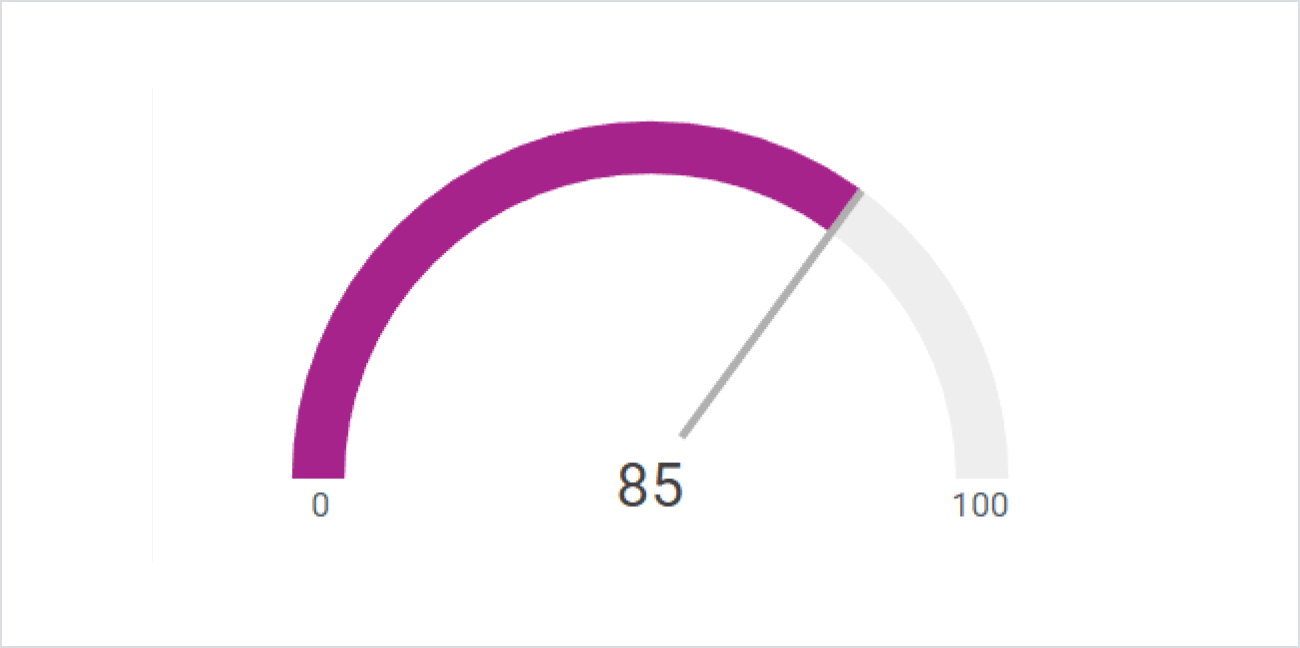
Gage or so called Gauge JavaScript widget will help you display dynamic data with smooth and interactive amination. You'll be able to setup custom labels, placeholders and dynamic color change.
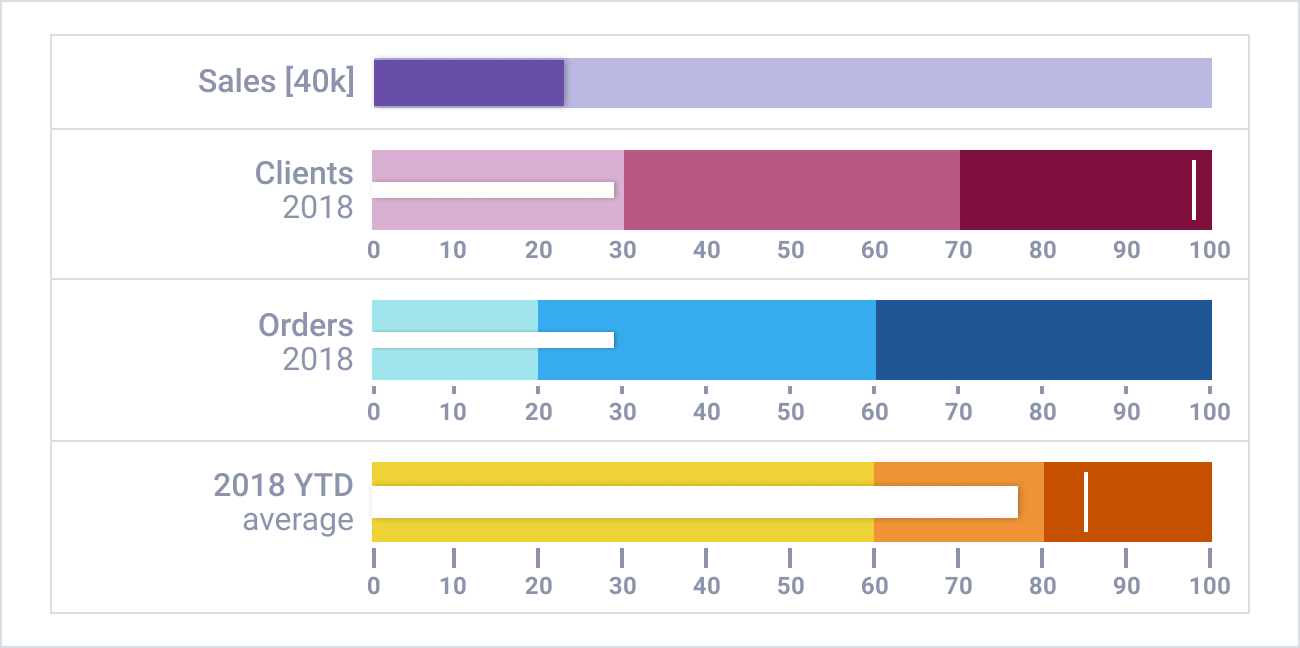
Data presentation and analytical widget for rapidly changing data sets. Bullet JS Widget will help you with dynamic data presentation and creation of data rich dashboards. Get advantages of predefined design for vertical and horizontal orientation and smooth animation.
Check also
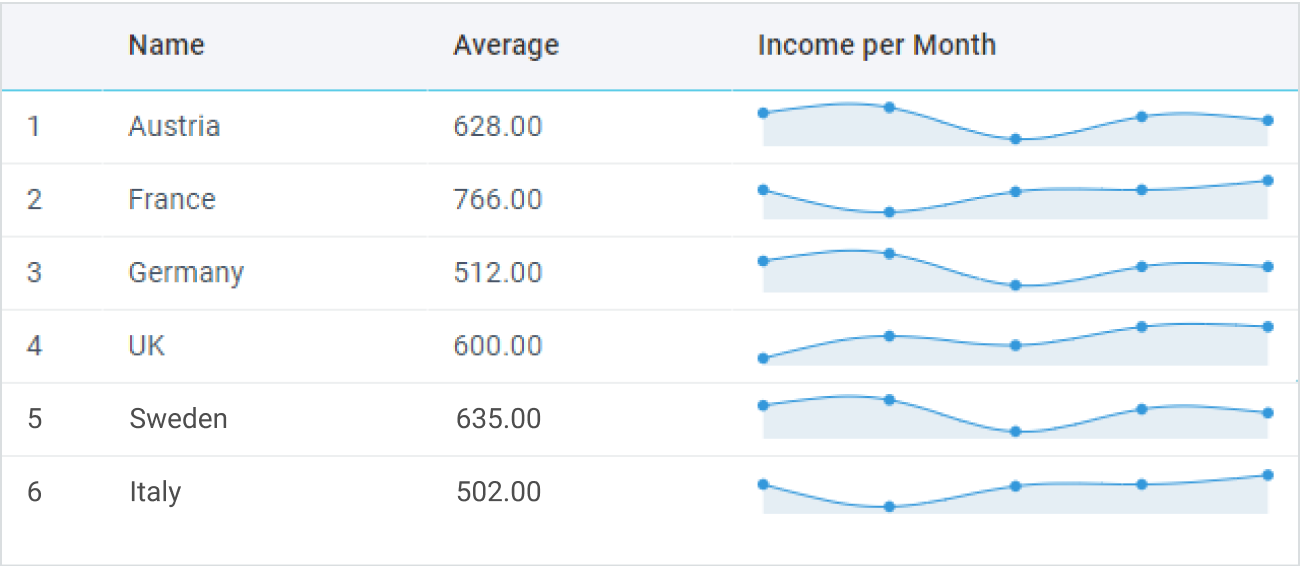
Useful data visualization feature for your DataTable.
Range control tool for number of Chart widgets.
