


Pivot Table JavaScript UI widget for web developers
Create a pure JavaScript Pivot Table component to your enterprise web app with a few lines of code.
Webix JS Pivot Table (Grid) advantages
No back-end is needed
Webix Pivot allows to make all calculations in the browser. Users can create any reports without programming.
Remote data processing option
It is possible to configure Pivot Table in such a way that its data are processed by a custom server-side script.
Highly optimized pure JavaScript
Fast calculations and responsive interface even while working with huge data volumes.
Pivot charts
Extended Pivot options to create summary reports with charts.
Easy back-end and front-end integration
Straightforward integration with various back-ends (PHP, Node.js and .NET) and front-ends (jQuery, AngularJS, Vue.js, React and many third party libraries).
Customizable
All elements can be adjusted through API, without need to edit anything in source codes (which are provided by the way).
Advanced Pivot features for your JavaScript web apps
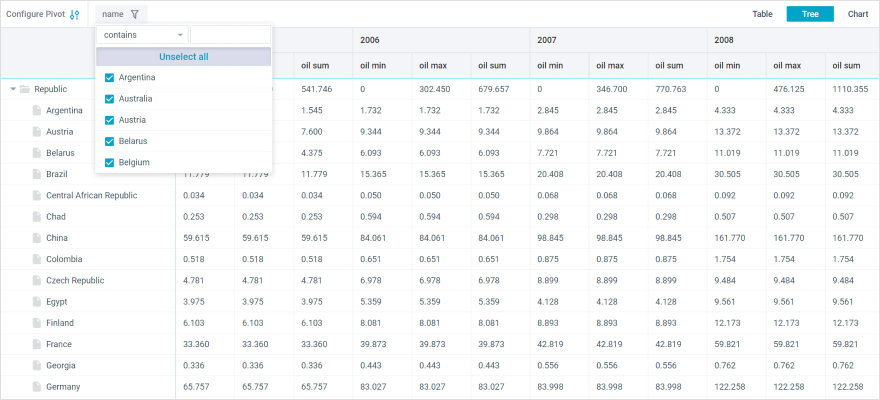
Easily search for the necessary data with the help of visual tools
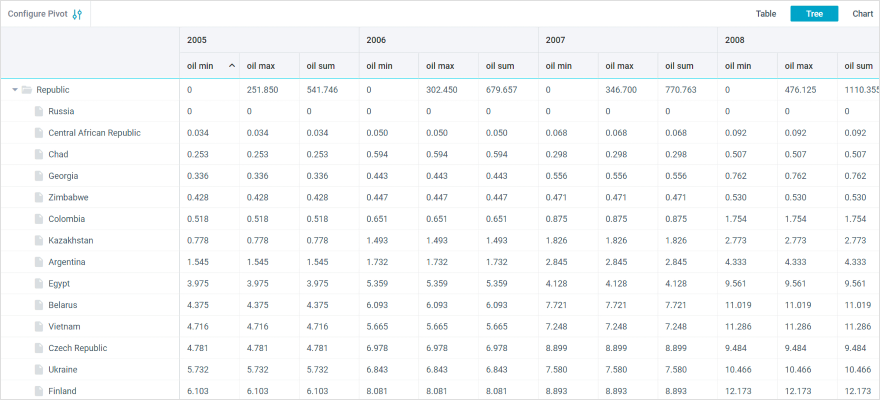
Track changes in parameters by sorting in ascending and descending order
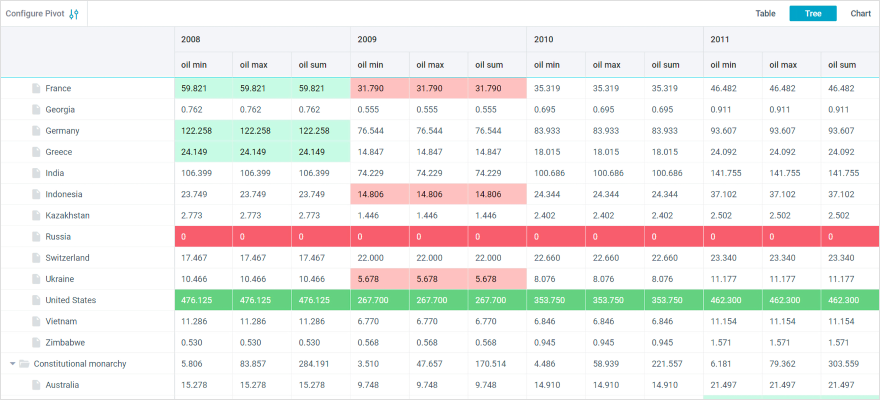
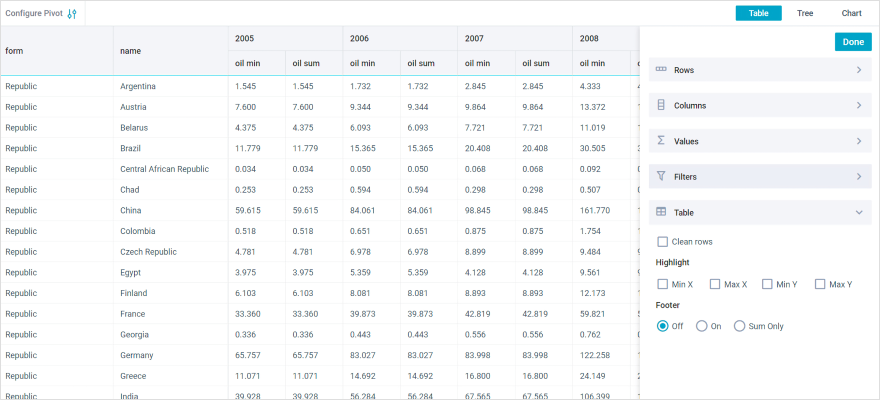
Highlight important information in different colors, highlight the maximum and minimum values in rows and columns
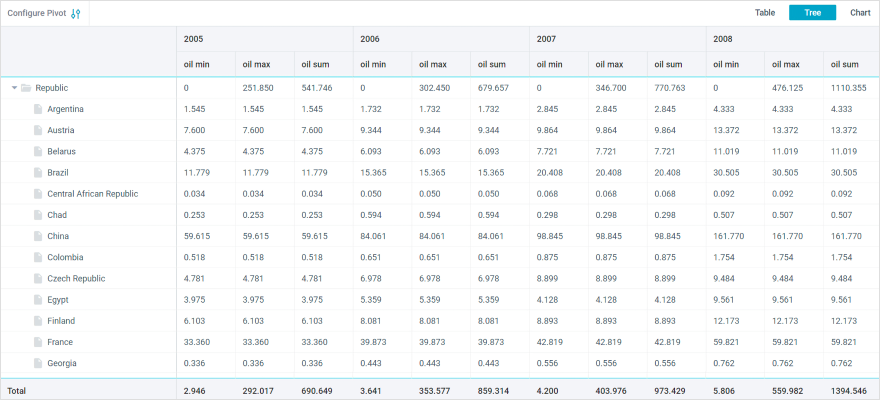
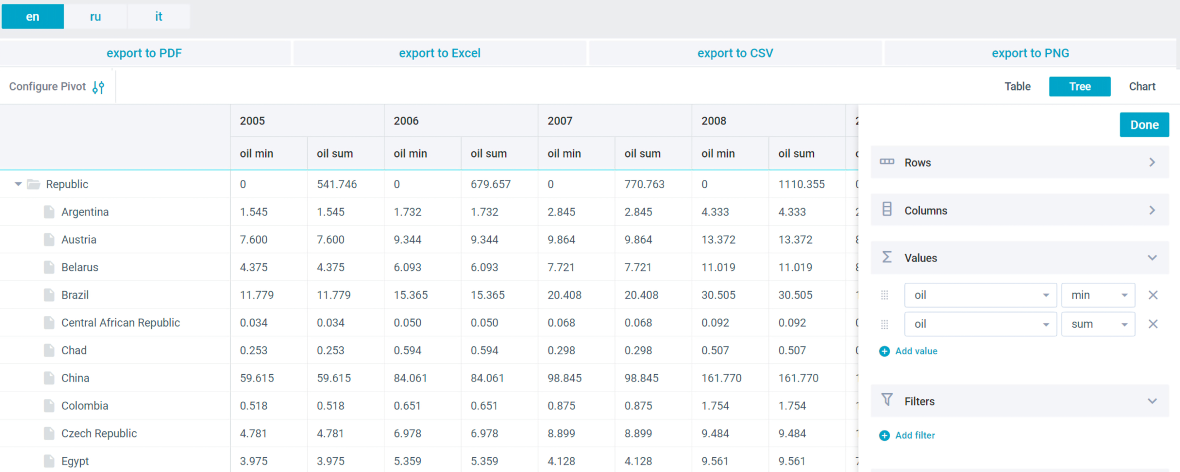
Summarize the indicators in the rows and columns of the reports
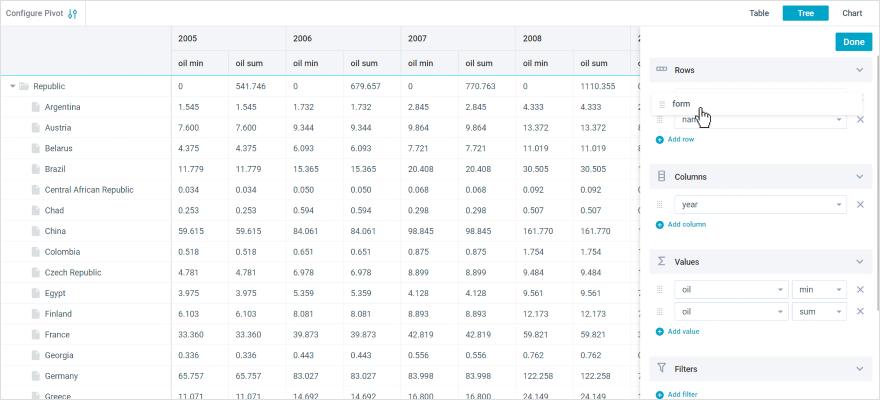
Change the order of rows and columns of the Pivot Table by dragging elements of the configuration window, adding custom configurations
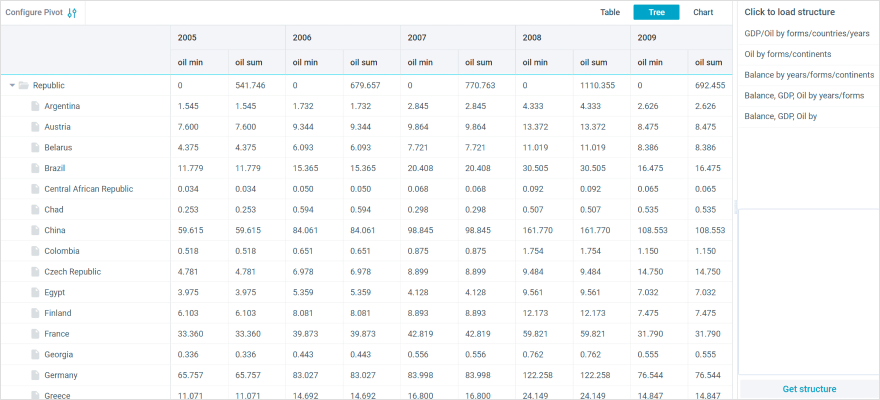
Create and apply structures to change the representation of data in one click
The ability to conveniently configure the report