Control widgets
Pivot Chart JavaScript UI widget for web developers
Add a pure JavaScript Pivot Chart to your enterprise web app by writing 5 lines of code
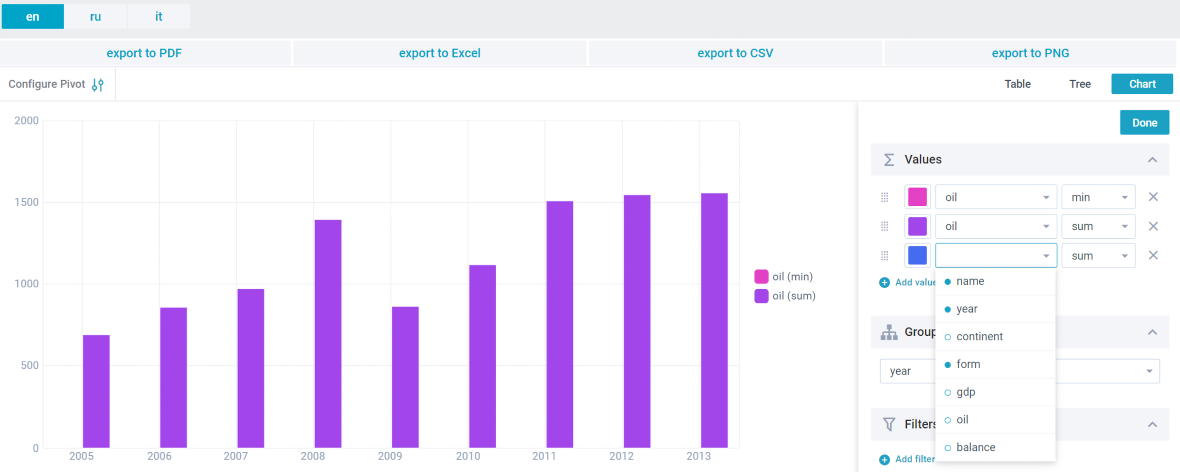
1. Data visualization
Extract and display the most significant information from complex data sets. Analyze, research and compare complex data with ease.
2. Data export
Export data in various formats: PDF, PNG, Excel, CSV.
3. Flexible UI customization
Customize chart settings, tune the configuration window and adjust the filters.
4. Custom operations
Create own grouping functions for data aggregation.
5. Localization
Adjust numbers and text labels in compliance with the rules of various countries.
6. Three modes of viewing aggregated data
Viewing data in the form of Table, Tree, Chat.
Why use JS Pivot Chart?
Easy backend integration
Explicit Integration with PHP, Node.js, Golang and .NET.
Cross platform and browser support
Support of All Modern browsers.
Easy frontend integration
Сan work with all modern frameworks. You can use it standalone or inside the React of an Angular app.
Customizable
All elements can be adjusted through API, without need to edit anything in source codes (which are provided by the way).
Advanced Chart features for your JavaScript web apps

Find and display specific data using various filters.
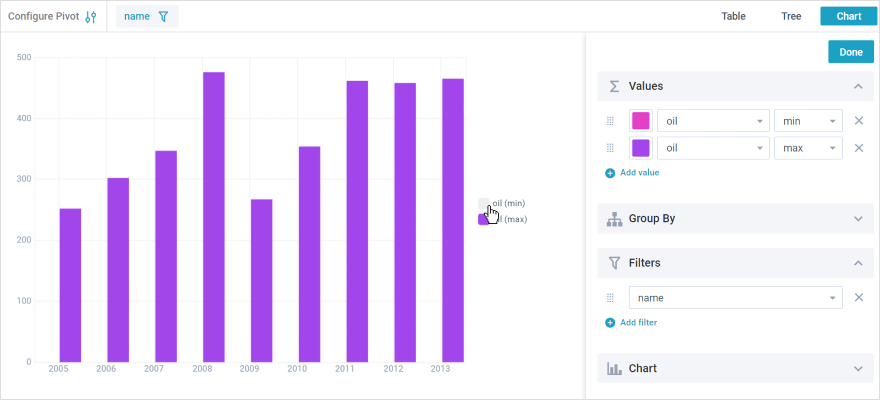
Show and hide charts in one click.
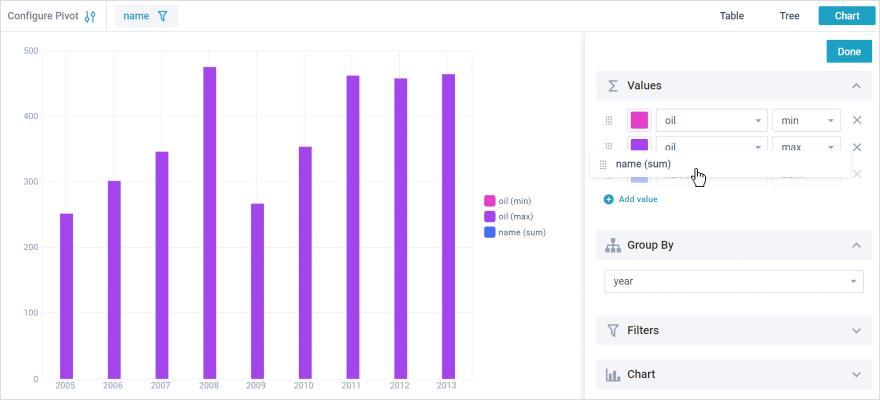
Change the order of PivotChart rows and columns by dragging configuration window elements, adding custom configurations.
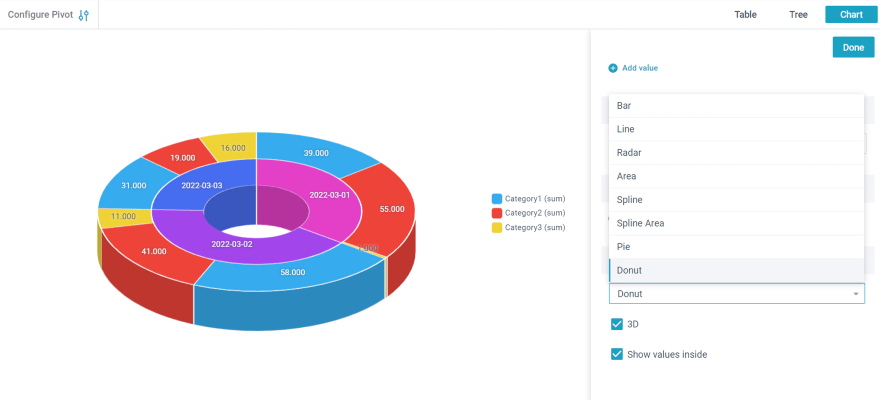
Choose the chart type you like.
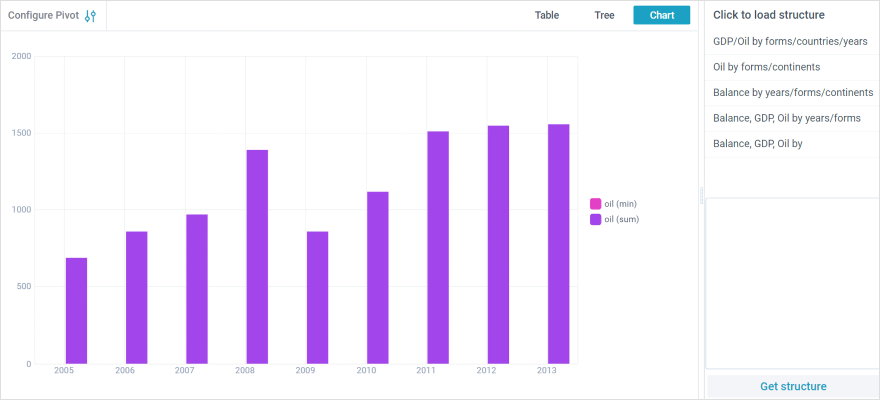
Create and apply structures to instantly change the appearance of charts.
Create rich user interfaces with Pivot Chart JS widget
Webix JavaScript UI widgets and controls
Control widgets


